Even
with the introduction of Query Store in SQL Server 2016 and with the
introduction of automatic tuning in Azure SQL database, there is benefit to
capture and retain diagnostic performance metrics. This post explains a lightweight
way to use well-known DMV queries to capture key SQL Server performance data
for alerting and long-term reporting. It involves creating a database on the
server(s) to be monitored. The script for the database is here.
This
system captures data for (1) weight statistics, (2) SQL I/O and (3) stored procedure performance. Below are a few reports to illustrate what
sort of visualizations are possible with this approach. After that, I provide a
brief explanation of how it works including everything you need to try it out
yourself.
(1) Wait Statistics showing by date - wait task/sec (gray bars), avg
resource wait time (blue) and avg signal wait time (green). For more
information on wait statistics, visit this article by Paul Randal.
(2) SQL I/O showing by date - read/write counts (bars), avg write wait
time (blue) and avg read wait time (orange).
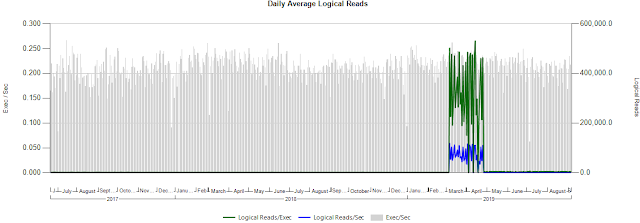
(3) Stored Procedure Performance – 3 samples below
(a) Graph showing sproc execution
rate (gray bars) and tuning benefit reducing CPU and Wall Clock from 20ms to
5ms
(b) Two graphs (CPU/Wall
Clock & Logical Reads) showing sproc degradation (resulting from uplift of compatibility to SQL 2014) and benefit after resolution. Weekly subscription
of these graphs provided quick alerts and timely resolution, also with the visibility to quantify/confirm the benefit.
(c) Sample illustrating performance
degradation and long-term benefit of resolution.
These
three metrics (wait stats, i/o, sproc performance) have corresponding tables in
the database each joining to common dimension tables. Below is a diagram of the sproc performance tables.
SQL
Server dynamic management views (DMVs) which are the source of this data are cumulative
and so capturing data for a slice of time involves taking a data sample, waiting
some time, taking a 2nd data sample and then calculating deltas. In
the database there is a sproc named uspCaptureMetrics which does all of this this. For wait
stats and i/o, it captures the two data samples with a 10 min interval in between.
Due to complexities of sproc (re)compilation and procedure cache, sproc performance
works by taking 120 samples waiting 5 sec in between each sample. Then
calculates the performance deltas by sproc for the greatest delta duration.
uspCaptureMetrics takes 10 min to run with almost all of the time being WIATFOR in between execution of DMV queries. It is very lightweight. Recommendation is to create an agent job to execute uspCaptureMetrics every 15 minutes resulting in the ability to report down to the quarter-hour, making detailed visualizations like the one below possible – showing a CPU/exec reduction specifically between 5:00pm and 5:15pm on 8/1/2018. Likewise, this level of detail for a performance degradation greatly helps identify root cause.
uspCaptureMetrics takes 10 min to run with almost all of the time being WIATFOR in between execution of DMV queries. It is very lightweight. Recommendation is to create an agent job to execute uspCaptureMetrics every 15 minutes resulting in the ability to report down to the quarter-hour, making detailed visualizations like the one below possible – showing a CPU/exec reduction specifically between 5:00pm and 5:15pm on 8/1/2018. Likewise, this level of detail for a performance degradation greatly helps identify root cause.
To
retain data long-term, you can implement a nightly ETL to a warehouse. This
enables identifying longer term cyclical patterns and also makes possible long-term visualizations emphasizing for management the on-going benefits
of specific tuning actions.
Running this system in development and test environments provides for a shift-left to identify and resolve performance issues before going to production.
Running this system in development and test environments provides for a shift-left to identify and resolve performance issues before going to production.
The
visualizations are reports in SSRS. That is beyond the scope of this post. Once
you have the data, writing queries and reports is a necessary but not
difficult task for someone with that skill set.
Query Store and Automatic Tuning have their place but as a complement to these tools, capturing and retaining system performance metrics provides invaluable insights.
Hope this is of some use.
Query Store and Automatic Tuning have their place but as a complement to these tools, capturing and retaining system performance metrics provides invaluable insights.
Hope this is of some use.


